Mirror your organizational structure. Map out your teams, entities, departments, business units, regions, etc. Need to add a business unit? No problem. Corporater allows you to make ongoing modifications.

Your solution, your way
Corporater was developed with a core belief that software should adapt to the way organizations manage their business, not the other way around. Corporater’s flexible configuration options enable you to configure your solution per your specific requirements and make ongoing modifications as your needs evolve. Integrate data from multiple sources, set up custom dashboards, automate complex processes, create exceptions to your rules, make changes to your organizational structures, and easily update your workflows when your requirements change.
With Corporater you are never stuck, never locked in.
Have it your way
Configure custom dashboards, automate workflows, visualize data, set up alerts, and more.
Customize and modify
Customize every page to your liking with your brand colors, images, and other design elements.
Optimize and scale
Make ongoing adjustments to your solution. Add entities and optimize your processes where needed.
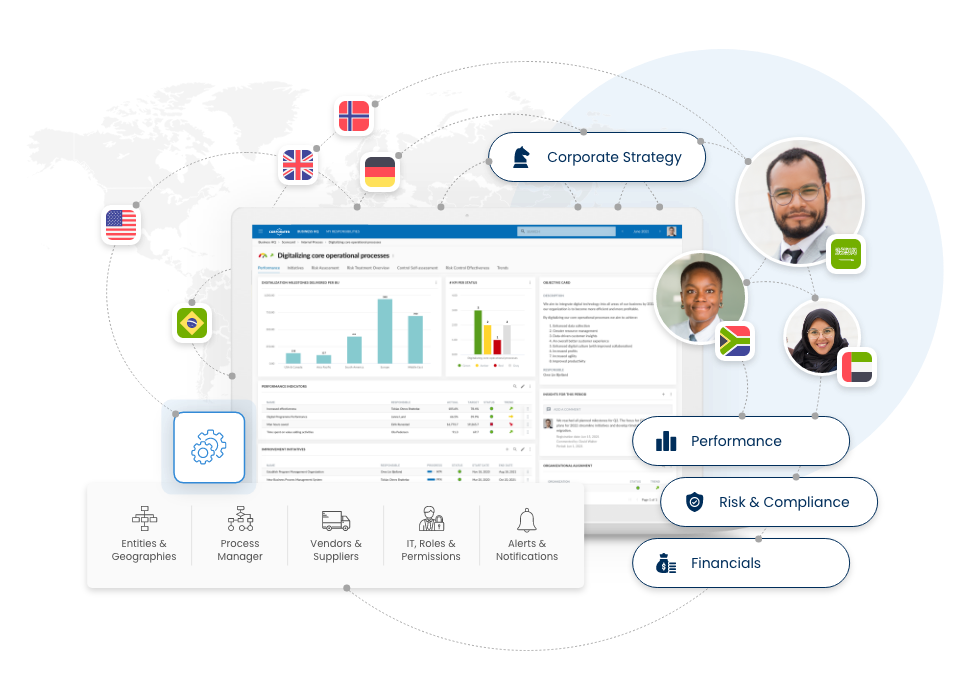
Create a digital twin of your organization
Corporater makes it easy for organizations to create a virtual representation of their organization. All Corporater solutions can be configured and maintained directly by the customer.
Map out your business processes and workflows. From simple to complex processes, Corporater allows users to automate system governance through a rule-based approach. As conditions are triggered, the system will run automatic tasks which includes notifications, creating objects, and more.
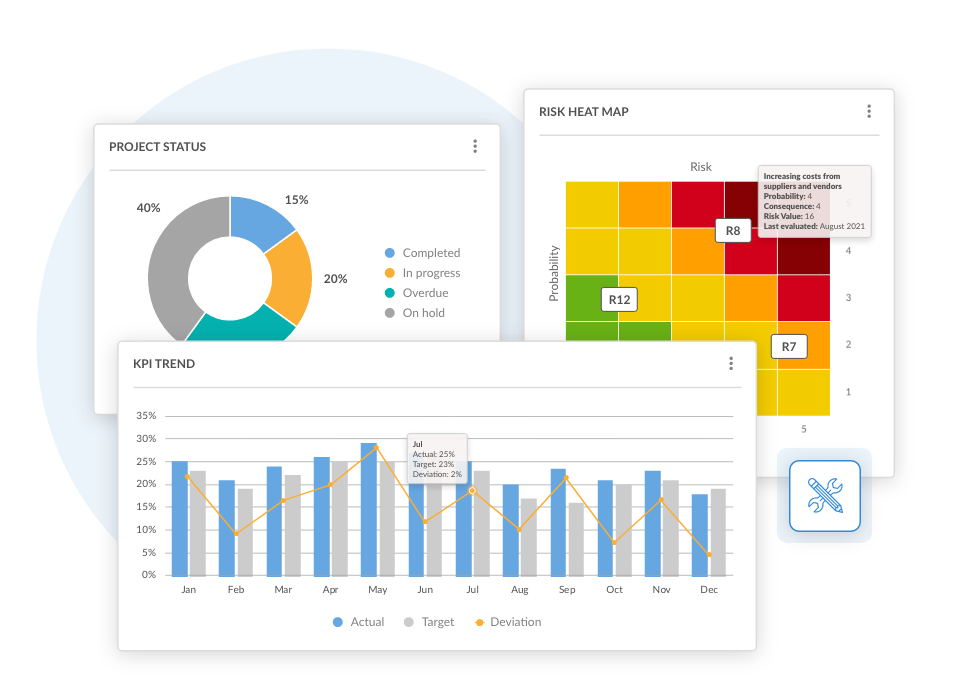
Visualize your data story
Transform your raw data into meaningful data visualizations to see status, trends, outliners, changes, and patterns in your data. As you execute on your strategy, Corporater powerful data visualizations let you tell the complete story of your journey and where you’re headed.
Choose from numerous graphic representations including charts, graphs, and risk heat maps, add your custom colors, and display them on your dashboards and reports.
Drill down on your KPIs. To display the status of a KPI, mouse over the KPI with your cursor. For a further drill-down, simply click on the KPI.
Column charts. Use standard column charts to track changes over time or compare data between different groups.
Pie and donut charts. Use pie and donut charts to show composition or percentage complete.
Risk heat maps. Use risk heat maps to present the results of a risk assessment process, including the likelihood and potential impact of identified risks.
Bar charts. Use bar charts to compare metrics such as performance or completion rates among multiple entities.
Area charts. Use area and stacked area charts to show how your values develop over time.
Bell curve graphs. Use bell curve graph to depict normal (Gaussian) probability distribution such as a result of risk analysis using Monte Carlo Simulation.
Line charts. Use line charts to show changes over time. Show data for one variable or compare data from multiple variables.
Radar charts. Use radar charts (a.k.a. spider charts) to compare two or more groups on various features or characteristics.
Bubble charts. Use bubble chart to depict and show relationships between numeric variables.
Bar-line charts. Use bar-line charts to compare metrics and see trends and developments over time.
Waterfall chart. Use waterfall charts to illustrate how positive or negative values in a data series contribute to the total.
Scatter plots. Use scatter plots to compare large numbers of data points without regard to time.
Tornado charts. Use tornado charts to depict the sensitivity of a result to changes in selected variables such as cost, time, quality and risk.
Gantt charts. Use Gantt charts to track progress and completion of tasks in your projects and portfolios.
Custom visualization. Use custom visualization when you need more flexibility.
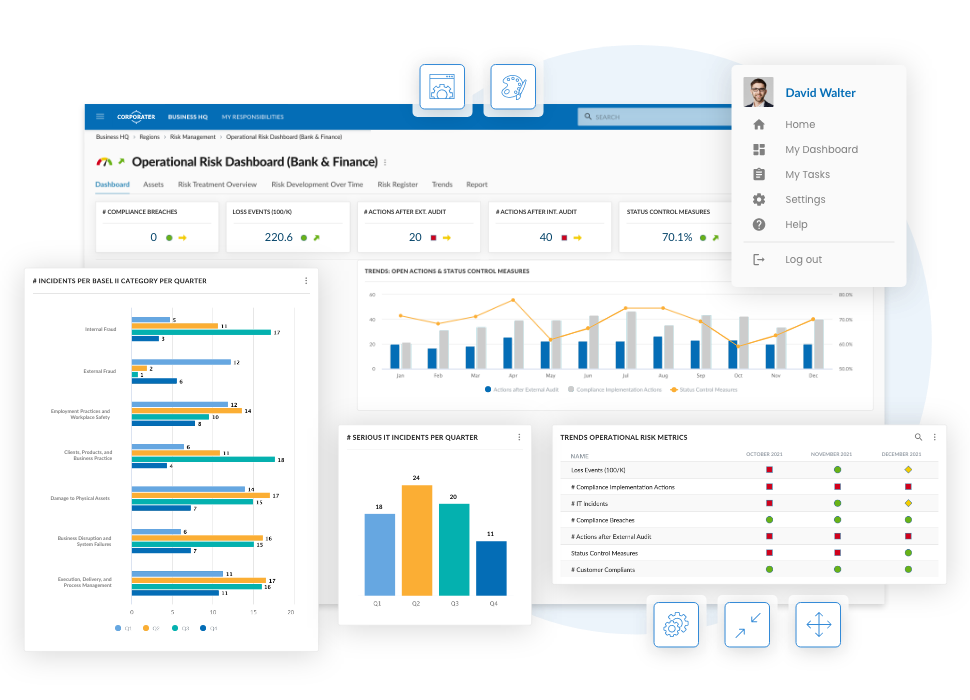
Configure custom dashboards, no coding needed
Configure custom dashboards to display relevant information, KPIs, and other metrics, based on specified organizational level.
Visualize, benchmark, and analyze critical management information within business context.
Save time by using templates. From risk factors to entire dashboards. Corporater templates make it easy create, manage and adjust your solution.
Assign user permissions to each dashboard. Manage content visibility and access to specific dashboards and features.
Integrate data from any source
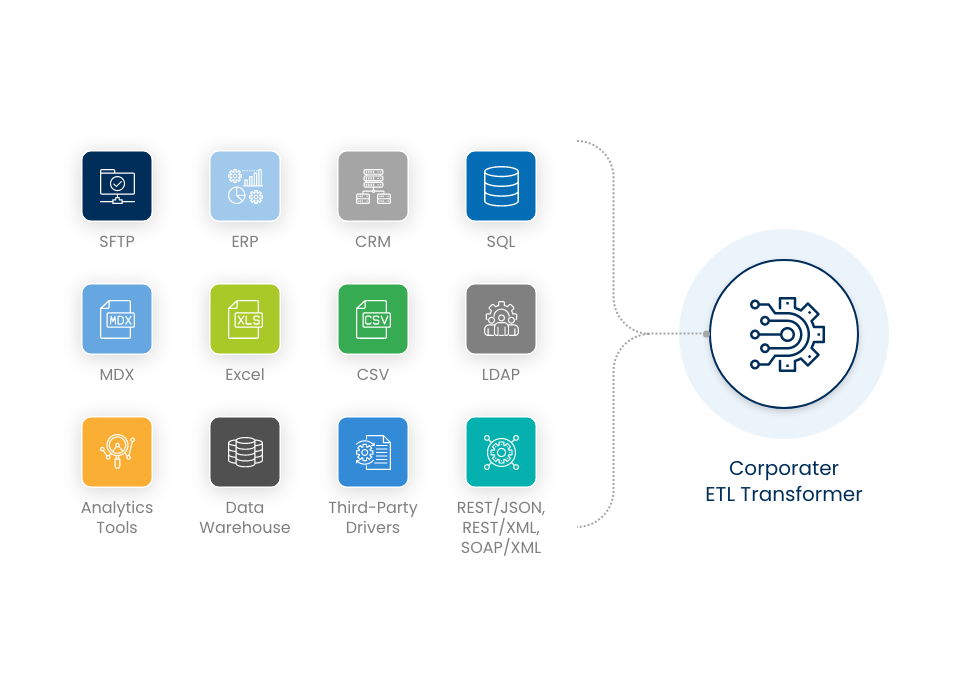
Implement an efficient data governance framework across your organization to provide your teams with a single source of truth. With Corporater Configuration Studio, you may connect and transform data from multiple sources, automate workflows, set up two way integration, control user access with SSO, and more.
Corporater ETL allows you to combine and process large amounts of structured and unstructured data, combine it with human input, and display it visually as insights on custom dashboards and reports.
Apply a theme to your solution
Use Corporater theming feature to change the look and feel of your dashboards. Use your brand color palette and apply it globally across all widgets within your solution.
You may choose to apply a global theme for:
- Color of top navigation bar
- Color of solution accent color
- Color of widgets’ surface
- Color of solution background
Prefer to set a custom settings for each page and widget? You may do that too.
Create custom page layouts
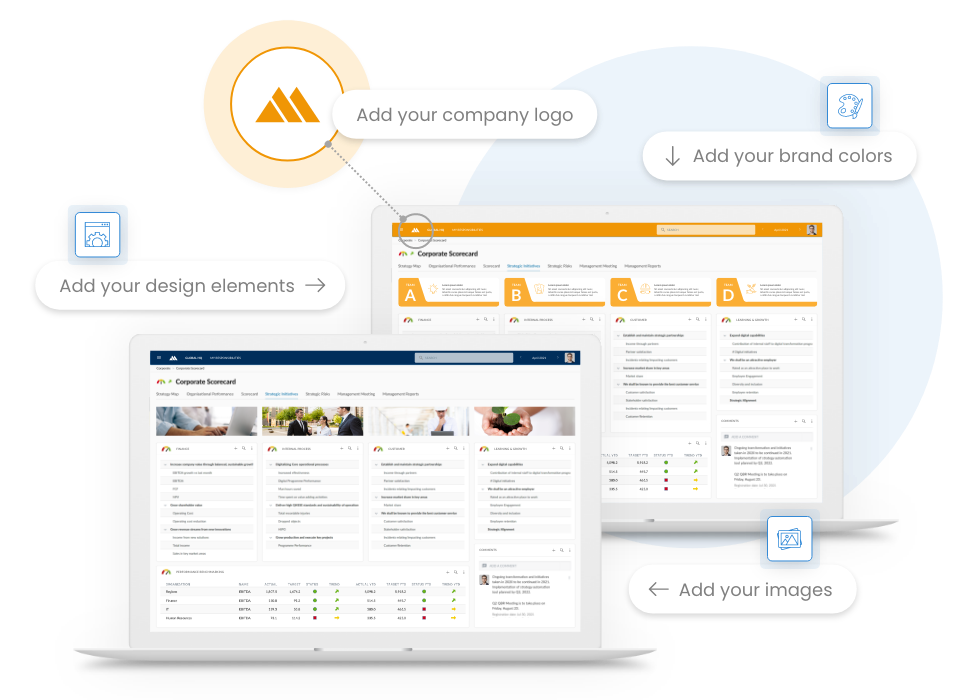
Make it your own. Use Corporater Configuration Studio to add background images, icons and other design elements to create your customized page layouts. No coding needed.
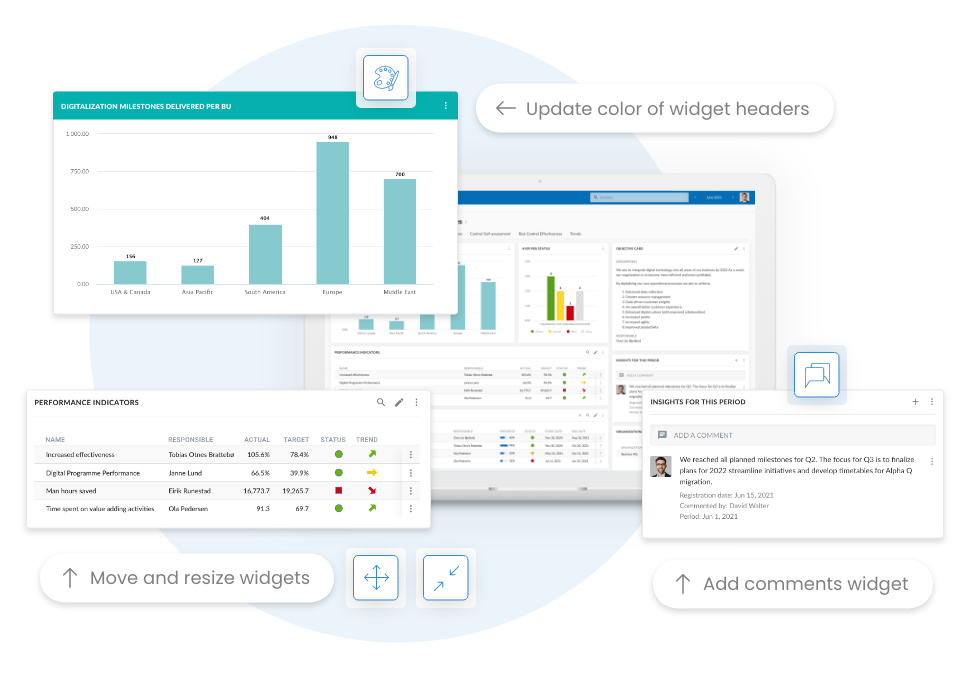
Add, resize, and reorder cards and widgets to your liking.
Update widget header colors to draw attention to specific metrics.
Add background images to make important pages stand out.
Include comments widget, so your teams can easily share ideas and feedback.
Make it your own. Use Corporater Configuration Studio to add background images, icons and other design elements to create your customized page layouts. No coding needed.
Add, resize, and reorder cards and widgets to your liking.
Update widget header colors to draw attention to specific metrics.
Add background images to make important pages stand out.
Include comments widget, so your teams can easily share ideas and feedback.
Customize your widgets
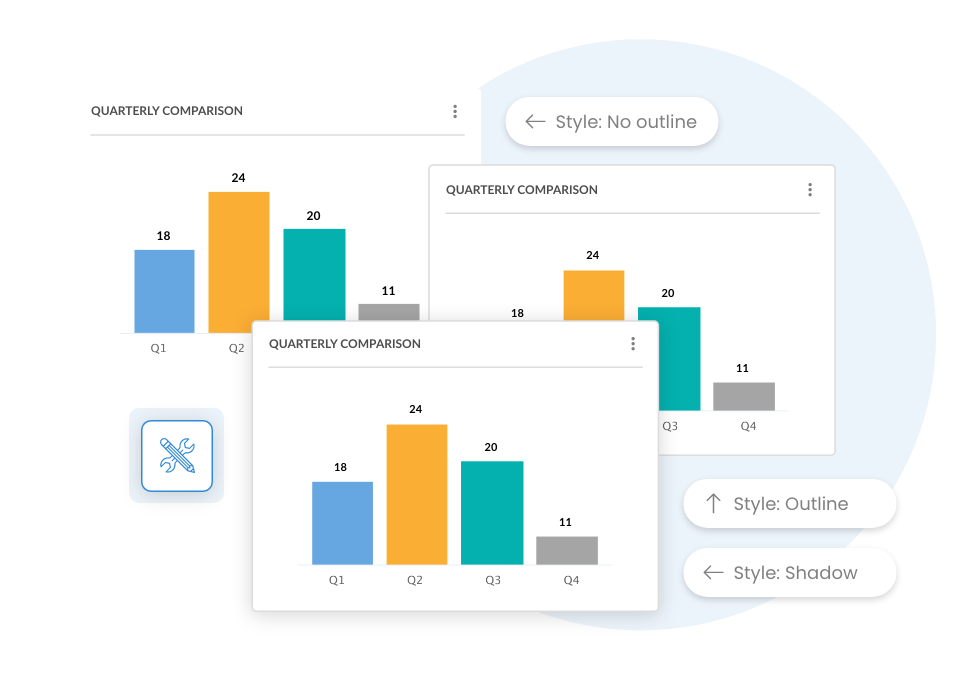
Change the look and feel of your widgets to make them more visually interesting and useful.
- Choose from six different header and outline styles
- Apply dropped shadow to add a dimension
- Apply partial or complete transparency
Change the look and feel of your widgets to make them more visually interesting and useful.
- Choose from six different header and outline styles
- Apply dropped shadow to add a dimension
- Apply partial or complete transparency
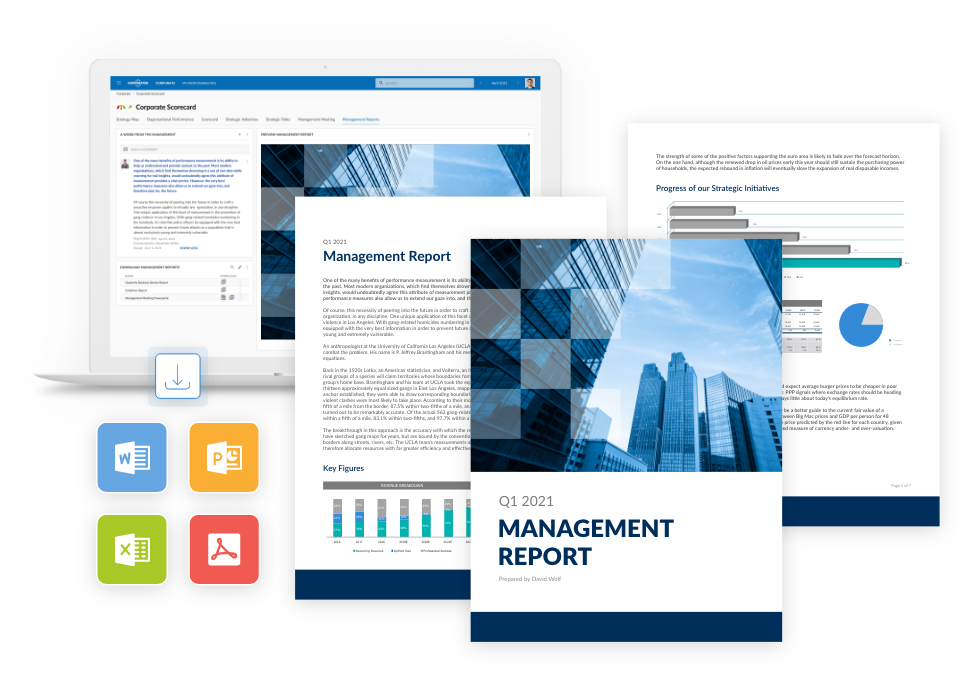
Automate your reporting
No more chasing around for data. No more copy & paste. Corporater enables you to pull information from your solution and generate comprehensive reports in a variety of popular formats.
Generate comprehensive reports in popular formats including Word, Excel, PPT, and PDF, and automate their deployment via email to specified stakeholders.
Create branded report templates with a custom cover page and custom-colored tables, charts, and graphs.
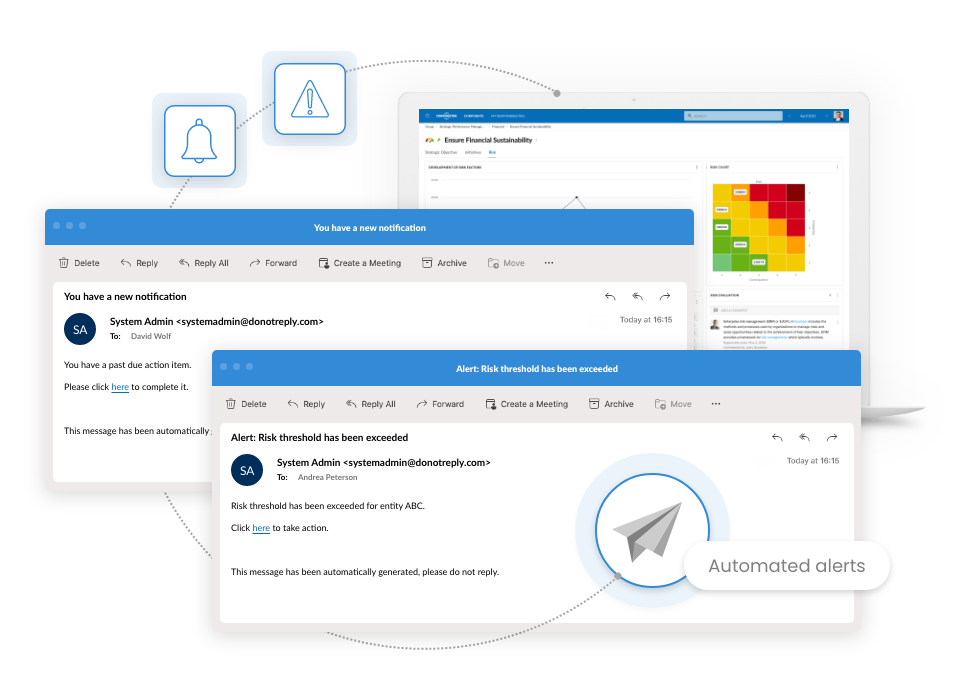
Set up alerts and notifications
Keep your teams informed and accountable.
Create custom alerts to notify key stakeholders when a KPI moves above or below a specified thresholds, when a goal is reached, or when a new issue arises. Define custom alert rules, frequency, and recipients.
Set up automatic notifications to communicate assignments, overdue tasks, approval status, and more.
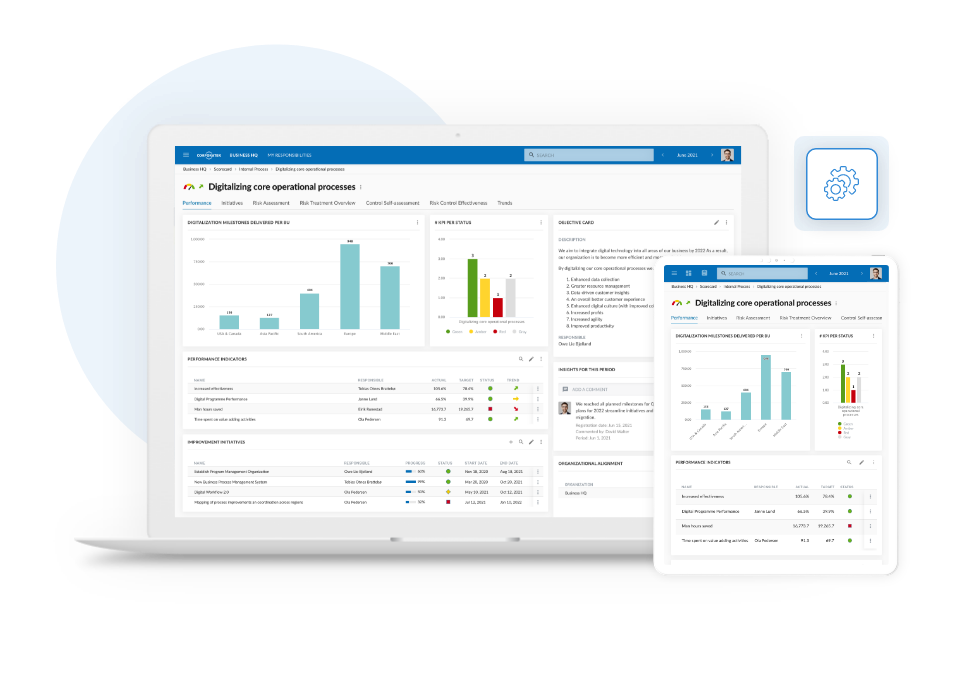
Configure once for all devices
Access your solution on any device.
Corporater is mobile responsive and optimized for all screen types and sizes. All cards, widgets, menus, and buttons that you create in Corporater Configuration Studio scale up or down and adapt automatically to all device types.
Adjust widget visibility. If you wish, you may set a custom visibility for any of your widgets – hide selected widgets on mobile, tablet, or desktop simply by clicking a check box in the widget settings.
What Our Customers Say
Hear directly from Corporater customers about their experience with our products, service quality, and support. All reviews are verified on Gartner® Peer Insights™.
Hear directly from Corporater customers about their experience with our products, service quality, and support. All reviews are verified on Gartner® Peer Insights™.