Dataset table
A Dataset table is a template that you define and use as the basis for producing charts and Table views. Choose which data to present and how to present them, based on node type, node, organization, function, etc.
By adding Views to a Dataset table you can use the table as the basis for benchmarking.
How to create a Dataset table
To create a Dataset table, go to the Template panel. It is a default panel in the Enterprise Performance Management model and can also be found under Structure in the Windows menu.
Right click in the Template panel to and choose Add -> Category, or use an existing category to store the table template. Then right click the Category and choose Add -> Table -> Dataset table. Double click the Dataset table to configure or use the Properties panel.
Properties
General
-
Name - the name "Dataset table" is generated automatically but it may be changed
-
Description - an optional text describing the table; displayed when you click Description in the drop-down for the object on the web
Configuration
- Table cell alignment - define how Corporater BMP aligns data content such as numbers and visual status indicators in columns.
- Default - aligns properties based on their type (i.e., text becomes left-aligned, numbers become right-aligned, and status bullets and gauges become center-aligned).
This option is selected by default for new dataset tables and for Corporater BMP versions whose databases are upgrades from previous versions.
- Center
- Left
- Right
- Default - aligns properties based on their type (i.e., text becomes left-aligned, numbers become right-aligned, and status bullets and gauges become center-aligned).
|
|
Audit
-
Modified by - the name of the last user to make changes to the object.
-
Last modified - the date and time when the object was last changed.
-
Created by - the name of the user who created the object.
-
Created - the date and time when the object was created.
Custom
The Table tab is divided into 4 panels: X-Axis, Y-Axis, Filter, and Property.
-
X-Axis - Right click the X-axis panel and choose what you want to display on the X-axis. You can configure an element in the Properties panel on the lower right.
-
Y-Axis - has the same alternatives and is configured in the same way as the X-axis
-
Filter - Specify an object or function that will influence what is displayed in the axes but that will not itself be displayed in the table. Most of the same alternatives are available as on the X and Y axes and can be configured in the same way.
You can choose one of the following in each of the first three panels:
-
Organization - choose the desired organization(s)
Property
-
-
Sum depth - how values of this and suborganizations are included in calculations: This, Subs, All (Sum depth is not available in the Filter configuration)
-
Depth - how children of the selected object are displayed:
-
This - selected element only
-
Children - subelements only (one level down from selected element)
-
This and children - selected element and subelements (one level down from current element)
-
All children - descendants, i.e. all subelements (all levels)
-
Entire branch - selected element and all subelements (all levels)
-
Siblings - selected element and all elements at the same level
-
-
-
This organization - show data for the current organization
Property
-
-
Sum depth - how values of this and suborganizations are included in calculations: This, Subs, All (Sum depth is not available in the Filter configuration)
-
Depth - how children of the selected object are displayed. See above for details
-
-
Node - choose the desired node(s)
Property
-
-
Depth - how children of the selected object are displayed. See above for details
-
-
Node type - choose the desired node type(s)
Property
-
-
Depth - how children of the selected object are displayed. See above for details
-
-
Function - choose the desired function
Name
-
-
Name - the name of the function
Use token tags in the function name to refer to the function context, e.g. "${this.organization.name} Actual" to include the organization name. This is the context of the chart/table view/report etc. where the Dataset table is displayed/used.
Click the down arrow to the right in the name field to open the editor where you can change the name by adding text or selecting other tags (properties) from the list.
Note that if the Dataset table has an organization in the filter, that organization will always be used in calculations, but the function name will continue to be based on the context of the original object. This may cause a table to indicate that values are for a different organization than the one that is actually used.
-
Function
-
-
Format type - configure the format if desired
-
Function - create a function using the calculator that opens automatically
-
Configuration
-
-
Include future values - if checked values for future periods as defined in a Time dataset will be included, if not checked they will not be included. This setting will only have meaning if a Time dataset is used.
-
Format
-
-
Format type - configure the format if desired
-
-
Expression - link to one or more Function expressions, to be used as functions
 Currently, it's not possible to link to Query expressions.
Configuration
-
-
Include future values - use only if the current selection on the X-axis is a Time dataset. Determines if the dataset table includes the values for future periods from the Time dataset. This option is selected by default.
-
Format
-
-
Format type - use to configure the format of the values.
-
Prefix - use to display a text or a symbol before the value. Example: enter a dollar sign ("$") for Corporater BMP to display "$5".
-
Postfix - use to display a text or a symbol after the value. Example: enter "liters" for Corporater BMP to display "500 liters".
-
Decimal places - applicable only for a Format type other than 'Duration'. Use to specify how many decimals Corporater BMP displays for the value.
-
Color style - use to highlight table cells that include numeric data.
-
Normal - displays numeric values in default color.
-
Positive in green & negative in red - displays positive numeric values in green and negative numeric values in red.
-
Positive in green - displays positive numeric values in green.
-
Negative in red - displays negative numeric values in red.
-
-
-
Function reference - select any Function object in the Model or Template trees to be used as a calculation basis for the row/column
Configuration
-
-
Name - In the Configuration panel on the lower right, you can see that Function references are named based on the dynamic tag language: ${this.object.name}. The name that this represents will be used in any charts or table views the Dataset table is connected to. The context from the function itself will be used. E.g. if you choose more than one function called “Actual”, you can insert the name of the KPI in front of the it, like this:
${this.object.kpi.name}:${this.object.name}
to make ”Costs: Actual” and “Income: Actual”. Adding this kind of information makes it easier to read charts and tables.
The name can easily be changed by adding text or selecting other tags (properties) from the list that opens when you click the down arrow on the right.
-
-
-
Include future values - if checked (default) values for future periods as defined in a Time dataset will be included, if not checked they will not be included. This setting will only have meaning if a Time dataset is used.
 The function referred to by a Function reference must be common to all the organizations used in the Dataset table, e.g. functions based on templates, if they
are to be compared in a table or chart.
The function referred to by a Function reference must be common to all the organizations used in the Dataset table, e.g. functions based on templates, if they
are to be compared in a table or chart.Tags should not contain white spaces, especially between $ and {.
E.g. $ { this.object.id } could be misinterpreted. The correct syntax is ${this.object.id}.
-
|
|
-
Time
Configuration
-
-
Use Context function - mark the box if you want to use an LVD function to define the period to show in the table
-
Context function - an LVD function that defines the start and end of the period to display in the table
Examples:
Node 100 has a value in May 2017 (only)
Node 101 has a value in Feb 2018 (only)
Period type = Month
Current context is May 2018
Results:
[100,LVD-BY,LVD+EY] - shows the full year in which the node last has a value: Jan 2017 - Dec 2017
[100,LVD,EOP] - shows the months from the beginning of the last value period until end of the current context period: May 2017 - May 2018
[100,LVD-5m,LVD] - shows last value period AND the five previous months: Dec 2016 - May 2017
[100,LVD,LVD]+[101,LVD,LVD] - shows the period containing oldest last value to the period with the most recent last value, inclusive: May 2017 - Feb 2018
If Period type = Year, then:
[100,LVD-3Y,LVD] - shows the year containing the last value and the three previous periods (years, in this case): 2014-2017
-
Period type - the type of reporting period (week, month, year, etc.)
 If you use Period = Year, make sure to set the Time dataset to use long names (January 20102018) to avoid confusion.
If Use Context function is not selected, these properties should be used instead:
-
Previous - number of previous periods to include
-
Next - number of following periods to include
-
Interval - the interval to be displayed
When Context function is not used, Time datasets
use a counter that counts the number of time elements for that Time dataset. E.g. if you specify 2 in both Previous and Next, you will always see
a total of 5 periods with the selected period in the middle, no matter what period is selected in the Period selector. If you mark January when the Period selector shows February, you will always see "the month previous to
the selected month" as you move to different periods.This will also be the case for Time datasets that span multiple years. So when you check "January 2018" this does not really mean January 2018. It means that you have checked "the first month in the current year". So when you go to 2019, January 2019 is checked instead because it is the first month in the current year.
-
-
Format
-
- Format type - select the date format to use: Short, Medium, Long, or Default
- Override date format - select to use a different date format in the table
- Overriding date format - select the date format to use from the associated drop-down list, or enter another format
-
-
-
Modifier function - create a function that modifies a node or any other function in the other axis. The Modifier function calculator is used to create functions, using so-called modifiers instead of nodes. They represent the nodes in the formula you wish to modify. $1 refers to the first node from the left in the formula, $2 to the second, and so on. Using [$A] apply the modifier to all the nodes in the function.
Name
-
-
Name - the name of the function; token tags may also be used; see above for details
-
Function
-
-
Function - the modifier function to use
-
Query - use to find objects to show on the x or y axis of the table; any object found will be added to row or column
-
General
-
Title - the heading of the query; can also be a token expression or a ordinary text
-
Filter - create conditions that define what you are looking for and where to look by selecting from the drop-downs in this section; this is similar to the filtering in Filtered list
-
Token - use the Reporter token language to access object properties on the cell context
General
-
-
Title - can be a token expression or a static text
-
Token function - the token expression to use
-
Examples:
-
-
-
${this.object.actual} gets the actual value of the current cell object
-
${this.object.statusValue} gets the status value of the current cell object and renders it as bullet
-
${this.object.statusValue.speedo} gets the status gauge value of the current cell object and renders it as status gauge
-
${this.object.statusValue.bullet} gets the status gauge value of the current cell object and renders it as bullet
-
${this.object.trendValue} gets the trend value of the current cell object and renders it as trend arrow
-
-
This functionality is intended to work only for some properties. It will work with the properties listed above; it is not intended
to work with properties such as:$ {this.object.description}
$ {this.object.responsible}
$ {this.object.statusAlgorithm}
$ {this.object.visibility}
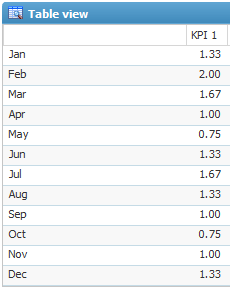
Add a Token dataset to the Filter of a Query dataset for powerful combinations.This configuration:
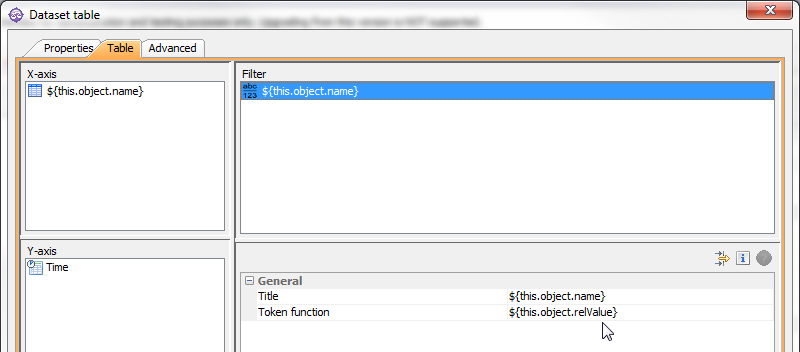
Could give this table on the web, showing the relative values (relValue) for each month:
Configuration
-
Include future values - use only if the current selection on the X-axis is a Time dataset. Determines if the dataset table includes the values for future periods from the Time dataset. This option is selected by default.
Advanced
ID
-
ID - a unique ID for the object.
By
default, Corporater BMP assigns consecutive numbers to new objects. You can change the ID to a value of choice that can include either letters or letter and number combinations.
The ID mustn't contain only numbers, include special characters such as ) ( . * } { + < > [ ], or match the name of a default object type in Corporater BMP.
Access control
-
Read accessors - click the Edit button (
 ) and authorize one or more users and user groups to view the object on Web.
 -
Add accessors - click the Edit button(
) and authorize one or more users and user groups to add new objects to the object on Web. -
Write accessors - click the Edit button(
) and authorize one or more users and user groups to edit the object on Web. -
Delete accessors - click the Edit button(
) and authorize one or more users and user groups to delete the object on Web. -
Ownership - click the Edit button (
) and grant ownership of the object to one or more users and user groups. Users and user groups who own the object have full access rights to it.
-
Override access profile - select for the object's access control setting to outrank the object's corresponding access settings in profiles.
View
To use the Dataset table, and any chart it includes, in benchmarking (comparison) on Web, you must also create a View. Right-click the Dataset table and choose Add -> View. Double click the View object to configure it.
When you preview a Dataset table that contains a View, the preview will show the objects that are marked in the View. If the Dataset table has more than one View,
the first one will always be used in the preview.Properties
General
-
Name - the name "View" is generated automatically but it may be changed
-
Description - an optional text describing the object
Audit
-
Modified by - the name of the last user to make changes to the object.
-
Last modified - the date and time when the object was last changed.
-
Created by - the name of the user who created the object.
-
Created - the date and time when the object was created.
Custom
The Custom tab contains three columns. Each of them corresponds to one of the panels in the Dataset table configuration: X-axis, Y-axis, and Filter. The objects you selected in the Dataset table are displayed here, and you can mark any or all of them to include them in a chart and or table view on the web page.
If you select 'this' more than once on an axis in the Dataset table, e.g. 'this' with Depth "This"
and 'this' with Depth "Children", you will only see 'this' once in the View configuration
in Configuration Studio, since it is context dependent. In the View configuration on the web you will see all available alternatives, according to the context. When editing a View in Configuration Studio, keep in mind that the "current context" is used when checking for organizations when the this reference
is used in one of the axes in the Dataset table. This may lead the user to select a different organization in the View than the one in which the Table view is located; the configuration may show organizations that are never applicable on the web.Example:
In Configuration Studio you creates a Dataset table with a View in the Template panel
Focus is on the organization South in the BMP model when you edit the View in Template
South appears as a checkbox in the View configuration, since it is "current context"
You checks South in the View configuration
You creates a Table view in organization North in the BMP model and link it to the Dataset table
On the web, you look at the Table view under organization North
North appears in the configuration but is unchecked because South was checked in Configuration Studio but is no longer relevant
Advanced
ID
-
ID - a unique ID for the object.
By
default, Corporater BMP assigns consecutive numbers to new objects. You can change the ID to a value of choice that can include either letters or letter and number combinations.
The ID mustn't contain only numbers, include special characters such as ) ( . * } { + < > [ ], or match the name of a default object type in Corporater BMP.
Access control
-
Read accessors - click the Edit button (
) and authorize one or more users and user groups to view the object on Web. -
Add accessors - click the Edit button(
) and authorize one or more users and user groups to add new objects to the object on Web. -
Write accessors - click the Edit button(
) and authorize one or more users and user groups to edit the object on Web. -
Delete accessors - click the Edit button(
) and authorize one or more users and user groups to delete the object on Web. -
Ownership - click the Edit button (
) and grant ownership of the object to one or more users and user groups. Users and user groups who own the object have full access rights to it.
-
Override access profile - select for the object's access control setting to outrank the object's corresponding access settings in profiles.
-