Waterfall chart
Description
Corporater BMP version 5.0.0.0 introduces a new object called Waterfall chart.
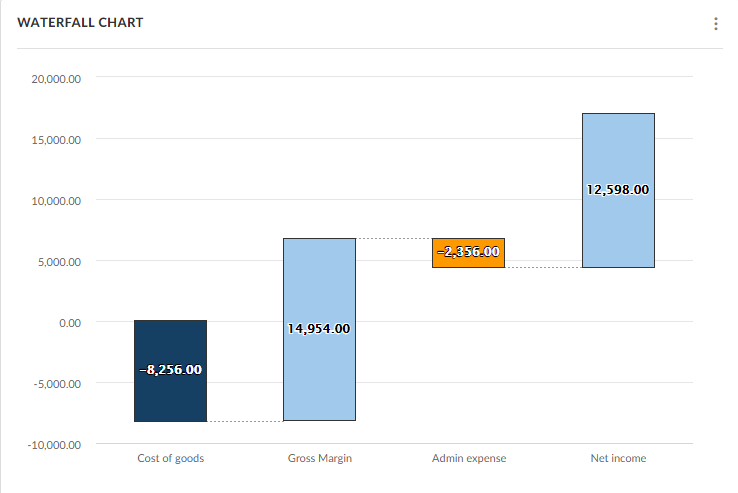
A Waterfall chart is a special type of column chart that focuses on a specific value, recording both positive and negative changes to the value over time and the resulting total difference. For example, you can use a Waterfall chart to illustrate how income and expense values result in a net value.
Configuration
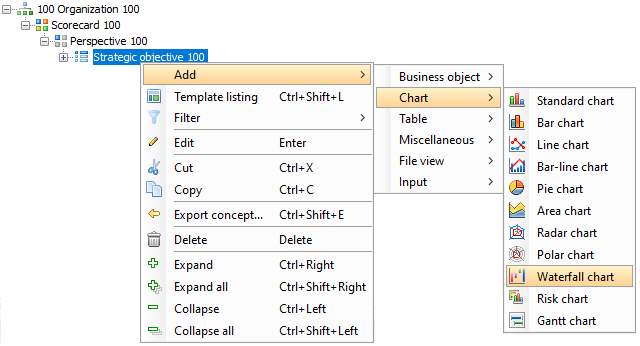
You can access waterfall charts from the Chart object category in Configuration Studio.

To configure a waterfall chart, you must link the chart to a table whose data is organized on the x-axis, such as:
![]()
For this table, the Waterfall chart displays as follows:
